Quality and Length of Life Data
Health-related quality of life includes the physical, mental, and emotional well-being of an individual. Health-related quality of life is associated with chronic disease prevalence and risk factors. Length of life is influenced by a variety of factors, including disease, health events, and social determinants of health. The public health and healthcare systems work to address health inequities that lead to reduced quality and length of life.
In 2017, we updated the 2015 Central Oregon Regional Health Assessment (RHA) with new data. This page provides an overview of updated data on quality and length of life. Please read through the information below, or download the quality and length of life health overview handout from the supporting documents section at the bottom of the page.
You can find additional data related to quality and length of life, as well as information on a variety of other health topics in the Regional Health Assessment Midpoint Update document.

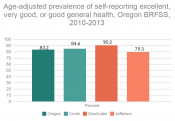
The Oregon Behavioral Risk Factor Surveillance System includes a telephone survey that allows us to learn about overall health, health conditions and health behaviors of adults in our community. Over 90% of adults in Deschutes County reported that their overall health was good, very good, or excellent.

Life expectancy at birth by race and ethnicity (CLICK FOR LARGER IMAGE)
We analyze data from Oregon Vital Statistics to determine how long people in our community live, on average. We can also learn if people in our community who identify as members of certain racial or ethnic groups have longer or shorter life expectancies than our population in general. People in Deschutes County live to be 81 years old, on average. In Central Oregon, life expectancy of people who are American Indian/Alaska Native is statistically shorter than life expectancy of the overall population. Life expectancy of people who are Hispanic in Central Oregon is statistically longer than life expectancy of the overall population.

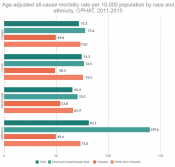
We also use vital statistics data to see how many people in our community die each year and to see if any groups die at higher rates than others. Mortality (death) rates per 100,000 from any cause were lower in Deschutes County than in Crook or Jefferson Counties. Since the 2015 RHA was published, mortality rates increased in Crook County but decreased in Deschutes and Jefferson Counties.
